¿Qué es la Encuesta sobre viajes diarios?
Queremos conocer sus hábitos de transporte diarios. ¿Cuándo viaja? ¿Viaja alguien con usted? ¿Cuánto cuesta cada viaje? Nuestro objetivo es obtener una imagen completa de los patrones de transporte en toda la ciudad para optimizar la planificación de mejoramientos en el futuro.
Queremos conocer sus hábitos de transporte diarios. ¿Cuándo viaja? ¿Viaja alguien con usted? ¿Cuánto cuesta cada viaje? Nuestro objetivo es obtener una imagen completa de los patrones de transporte en toda la ciudad para optimizar la planificación de mejoramientos en el futuro.
Para obtener más información sobre este estudio, lea nuestras preguntas frecuentes o comuníquese con nosotros.
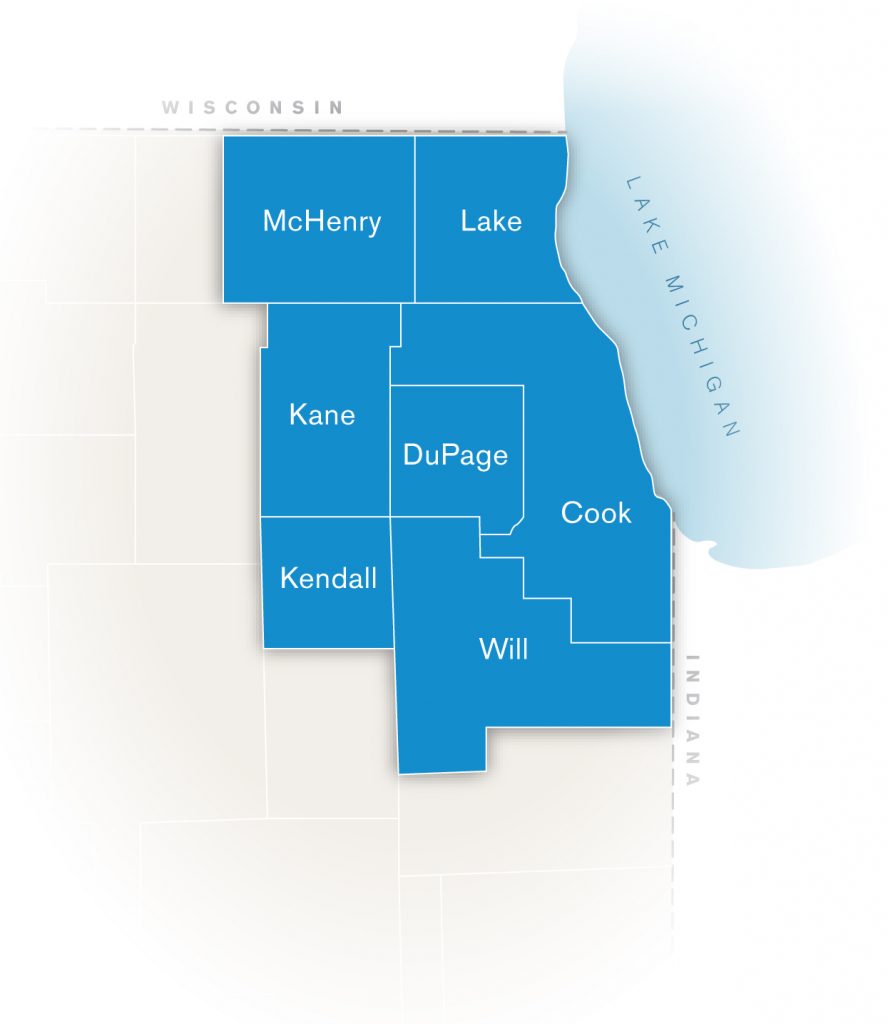
[Los condados incluidos en la encuesta se muestran a la derecha]
Results from the 2024-2025 My Daily Travel Survey
Results from the first round of the survey show that many travel patterns across northeastern Illinois have remained consistent over time, even after the disruptions caused by the pandemic. Residents continue to rely on different transportation options depending on where they live, their household income, and their access to transit.
Stable Travel Trends Over Time
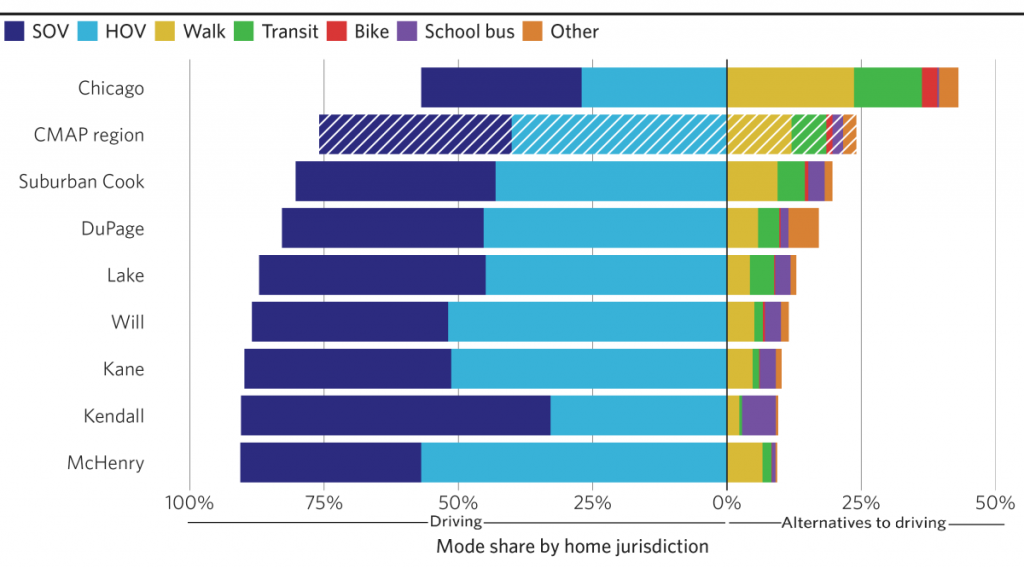
Driving remains the most common way people travel in the region, accounting for about three-quarters of all trips. However, Chicago and suburban Cook County residents continue to make a higher share of trips by walking, biking, transit, and other non-car modes than residents of the collar counties. These patterns are similar to findings from the 2019 travel survey.
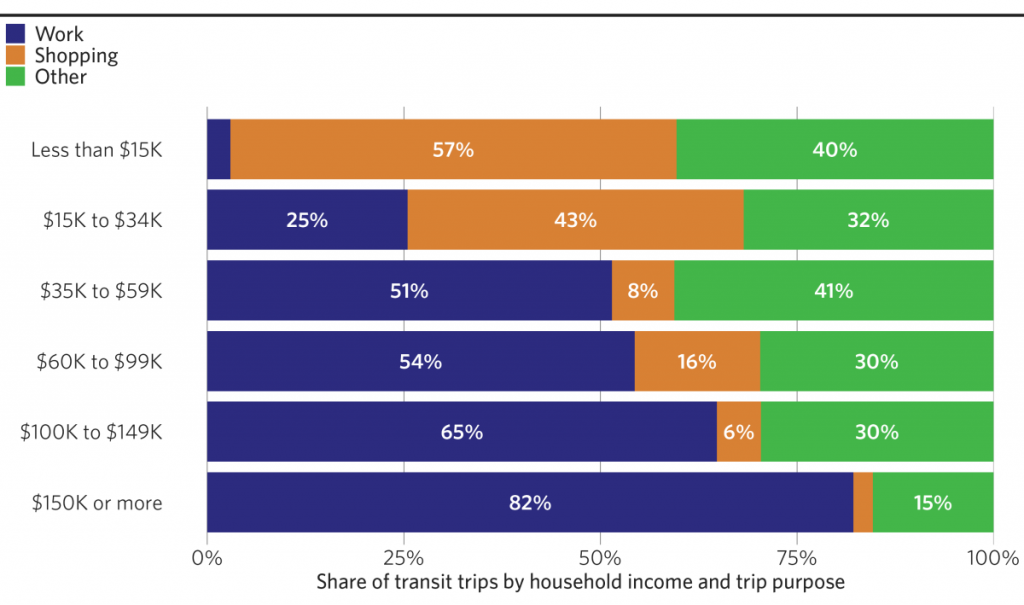
Transit use also continues to vary by income. Travelers from lower-income households used transit for a wider range of daily needs, including work, shopping, and other activities. Travelers from higher-income households used transit primarily for work trips.
Emerging Post-pandemic Travel Trends
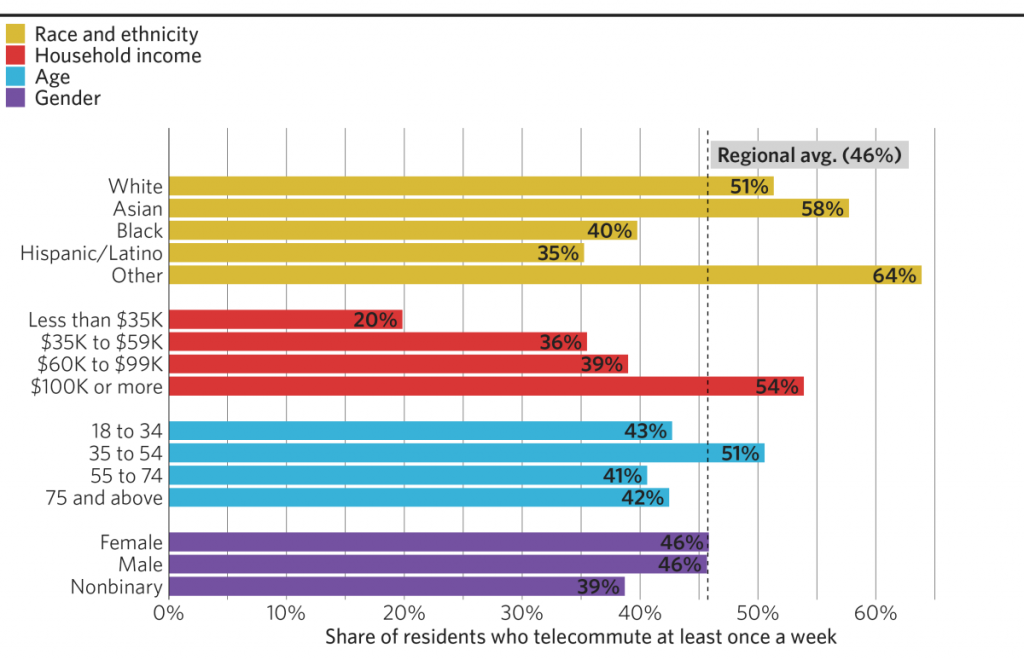
The 2024-2025 results also show several changes that may reflect post-pandemic shifts in how people live and work. Telecommuting increased substantially compared with 2019, with nearly half of employed residents reporting that they work from home at least once per week. However, telecommuting was not evenly distributed. Low-income residents, Black residents, and Latino residents were less likely to telecommute, while higher-income residents, white and Asian residents, and residents ages 35 to 54 were more likely to do so.
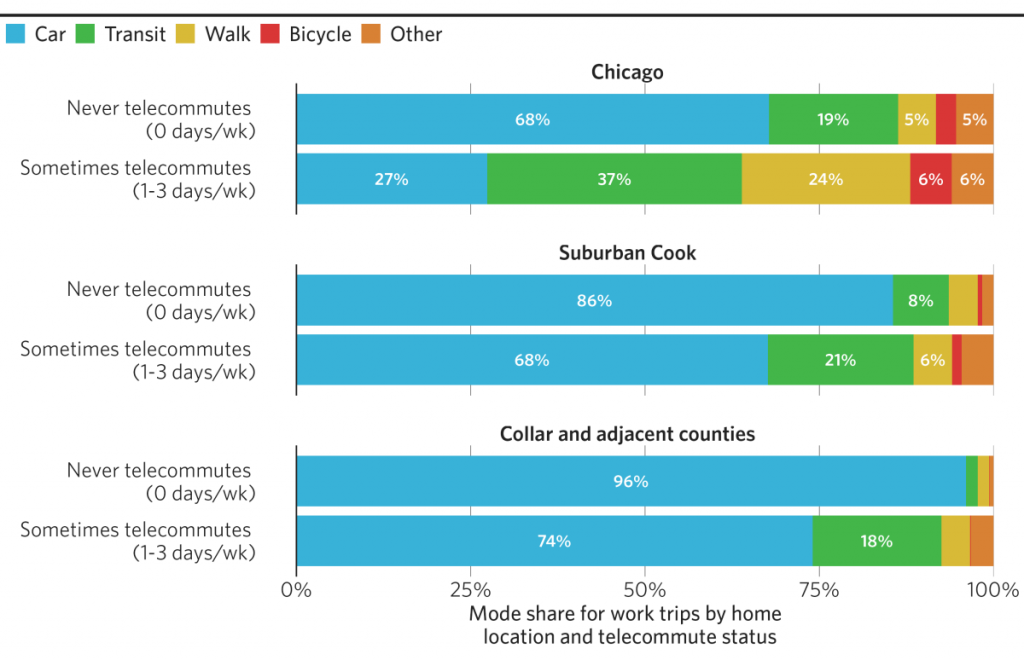
Part-time telecommuters were more likely to use transit for in-person work trips than workers who never telecommute. This was especially true for Chicago residents, but the pattern also appeared in suburban Cook County and the collar counties.
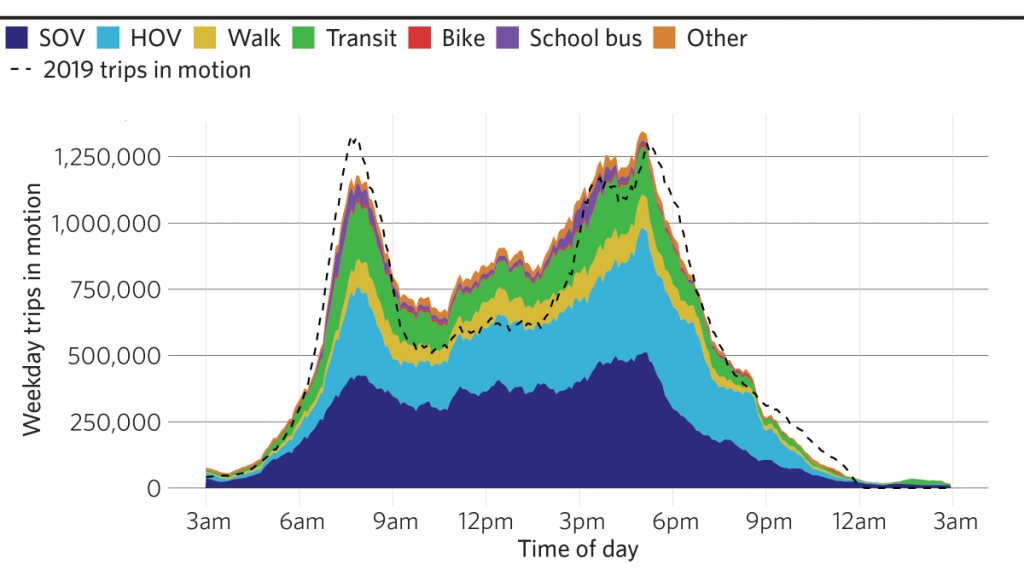
Weekday travel still has clear morning and evening peaks, but midday travel increased compared with 2019. This shift may be connected to higher rates of remote and hybrid work, which can give some residents more flexibility to travel during the day.
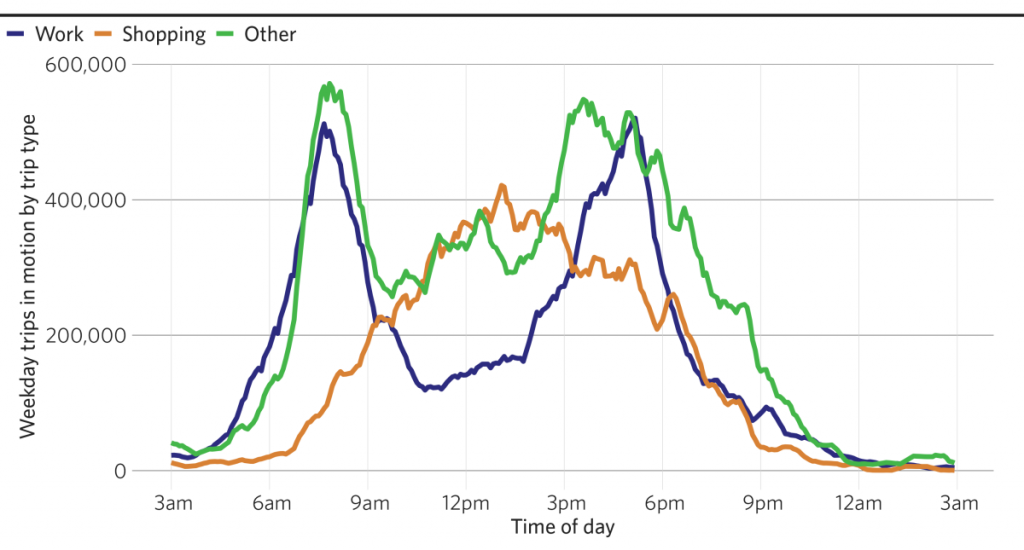
The increase in midday travel was largely driven by non-work trips, including shopping, school, meals, social, and recreational activities.
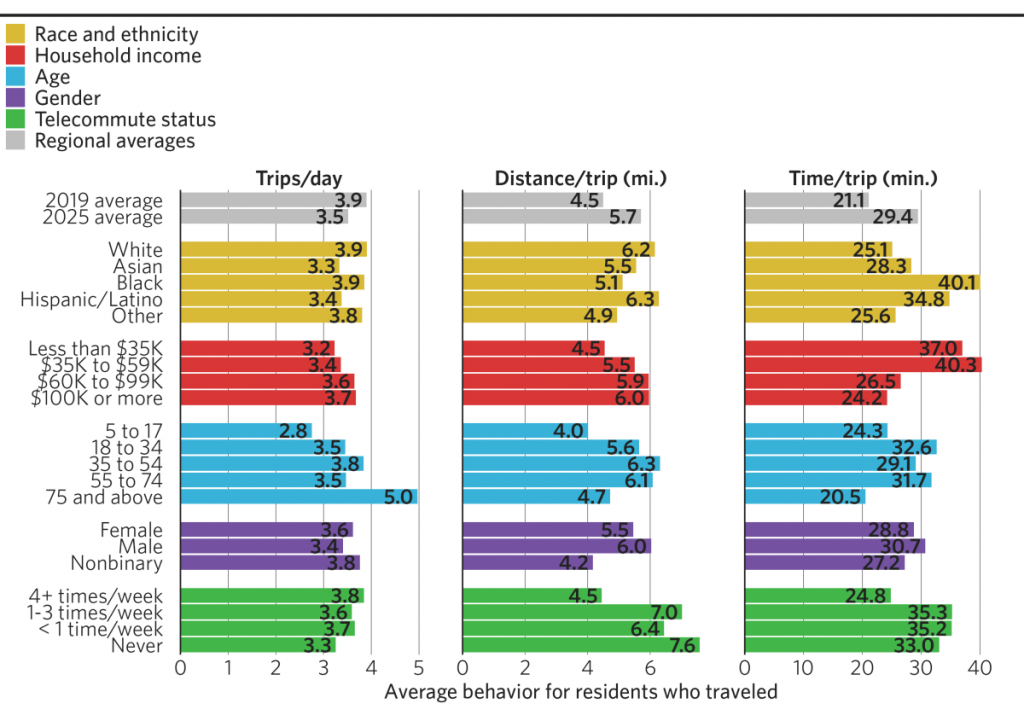
Residents are also taking longer trips on average. Compared with 2019, average trip distance increased from 4.5 miles to 5.7 miles, and average trip duration increased from 21.1 minutes to 29.4 minutes. These changes may reflect shifts in where people live and work, as well as changes in commuting behavior.
Together, these findings show that many long-standing travel patterns remain, while new post-pandemic behaviors are emerging. As the full survey continues, CMAP and its partners will use these results to better understand changing travel needs and plan for a transportation system that serves residents across the region.
 ES
ES  EN
EN